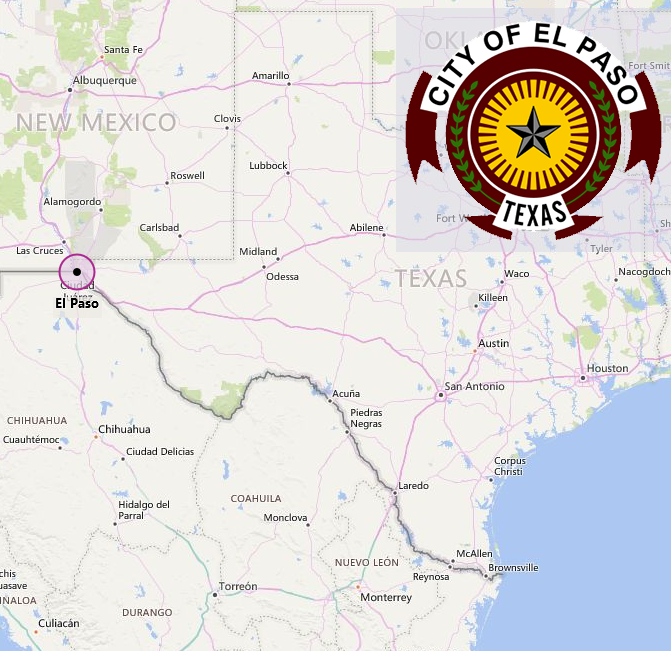
El Paso, TX
El Paso is the county seat of El Paso County in the state of Texas, located at northernmost part of the Rio Grande and neighboring the Mexican city of Ciudad Juarez, Chihuahua. As of the 2019 U.S. Census estimate it has a population of about 700,000. El Paso counts with 4 international bridges, one international rail bridge, and El Paso International Airport.
The Port of Entry (POE) of El Paso handled trade flows of almost $800B U.S.D. in 2019.
The El Paso POE (2402) is also the head of the trade District of El Paso, comprised of the Texas POE's of El Paso, Presidio (2403), and Fabens (2404), and the New Mexico POE's of Columbus (2406), Alburquerque (2407), Santa Teresa (2408), and Santa Teresa Airport (2481).
Source: U.S. Census, U.S. Department of Commerce Bureau of the Census Foreign Trade Division,
U.S. Customs, Texas Workforce Commission, Central Power and Light, local building departments and local U.S. bridge operators in cited cities.
Compiled by:Texas Center for Border Economic and Enterprise Development
City Section Last Update: July 2020
International Bridges
1: Paso del Norte (Santa Fe) Bridge
Pedestrians / Non-Commercial Vehicles / Buses
Mexico Border City: Ciudad Juarez, Chih.
2: Good Neighbor (Stanton) Bridge
Pedestrians / Non-Commercial Vehicles / Buses
Mexico Border City: Ciudad Juarez, Chih.
3: Bridge of the Americas
Pedestrians / Non-Commercial Vehicles / Buses / Commercial Trucks
Mexico Border City: Ciudad Juarez, Chih.
4: Ysleta-Zaragoza Bridge
Pedestrians / Non-Commercial Vehicles / Buses / Commercial Trucks
Mexico Border City: Ciudad Juarez, Chih.
R: Rail Bridge
Rail Crossing Only
Mexico Border City: Ciudad Juarez, Chih.
U.S.A.
Census 2020Texas
Census 2020El Paso
Census 2010El Paso
Census 2020Total
Households
Census Estimate 2015-2019
Language other than English at Home
Census Estimate 2015-2019People age 25 or higher
People age 25 or higher
People under age 65
People under age 65
Median Household Income
Census Estimate 2015-2019Total Workforce
Avg. 2020% Unemployment
Avg. 2020in the past 12 months (in 2019 dollars)