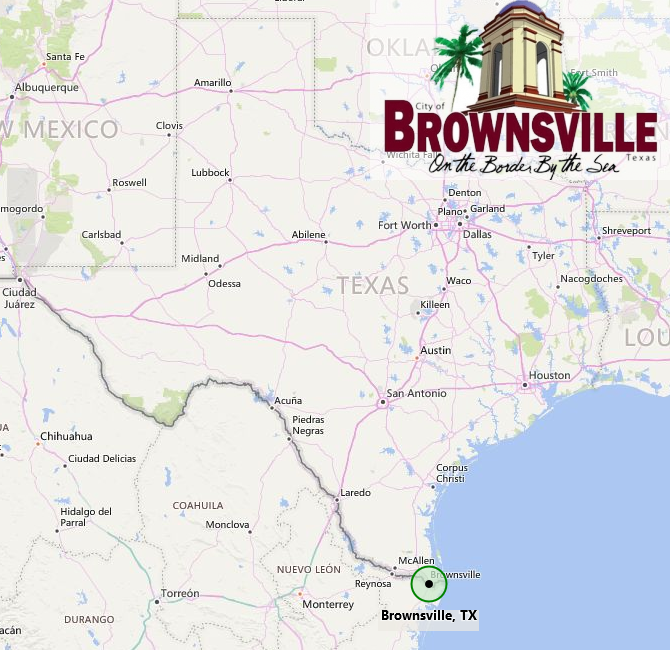
Brownsville, TX
The City of Brownsville is the county seat of Cameron County in the state of Texas, located in the southernmost part of the Rio Grande neighboring the Mexican city of Matamoros. As of July 2018, the U.S. Census estimates it has a population of over 183,000. Brownsville's international trade infrastructure covers land, sea, and air, (Vetran's International Bridge, B&M Rail Bridge, Port of Brownsville, and Brownsville/South Padre Island International Airport)
The Port of Entry (POE) of Brownsville handled trade flows close to $19B U.S.D. in 2019.
The Brownsville POE (2301) is part of the trade District of Laredo.
Source: U.S. Census, U.S. Department of Commerce Bureau of the Census Foreign Trade Division,
U.S. Customs, Texas Workforce Commission, Central Power and Light, local building departments and local U.S. bridge operators in cited cities.
Compiled by:Texas Center for Border Economic and Enterprise Development
City Section Last Update: June 2020
International Bridges
Bridge 1: B & M Bridge
Pedestrians / Non-Commercial Vehicles / Buses
Mexico Border City: Matamoros, Tam.
Bridge 2: Gateway International Bridge
Pedestrians / Non-Commercial Vehicles / Buses
Mexico Border City: Matamoros, Tam.
Bridge 3: Veterans International Bridge
Pedestrians / Non-Commercial Vehicles / Buses / Commercial Trucks
Mexico Border City: Matamoros, Tam.
Bridge R: B&M Rail Bridge
Rail Crossing Only
Mexico Border City: Matamoros, Tam.
U.S.A.
Census 2020Texas
Census 2020Brownsville
Census 2010Brownsville
Census 2020Total
Housholds
Census 2015-2019
Language other than English at Home
Census Estimate 2015-2019People age 25 or higher
People age 25 or higher
People under age 65
People under age 65
Median Household Income
Census Estimate 2015-2019 (2019 U.S. Dollars)Total Workforce
Avg. 2020% Unemployment
Avg. 2020in the past 12 months (in 2019 dollars)
(2015-2019)